UNCOMMON SENSE 1 © September 1997 [Rev.]
This issue was written at a time when the major source of deficits was recession. These days, it is military spending, tax cuts, and bank giveaways, which generate relatively few jobs, along with health care, as well as a slow-growing economy, so that our deficits are not merely cyclical1 but structural.2 This means we’d have a deficit even at high employment. The Congressional Budget Office [CBO]’s estimates of the “high employment” [5.5% unemployment3] deficit or surplus4 once usually showed at most a small deficit. In contrast, there has been a large high-employment deficit since Bush II and beyond. [The CBO appears to have given up calculating the cyclically-adjusted deficit.] “…looking at data back to the late 1940s, the average deficit-to-GDP ratio when unemployment was below 5 percent was close to zero. Since 1980, that same calculation yields an average deficit-to-GDP ratio of 0.5 percent. … the jobless rate this year may average less than 4 percent while the deficit-to-GDP ratio could be about the same, and closer to 5 percent next year.” [Jared Bernstein’s blog] Needless to say, it is still true that deficits are smaller with higher employment [see graph below. U rate in blue, federal deficit [inverted] as -% of GDP in red]
This CPEG powerpoint presentation explains why significantly reducing the current federal deficit will cause higher unemployment, unless accompanied by trade deficit reduction or another deficit bubble. [JZ, Editor, 6/15]
By Helen Ginsburg, Professor of Economics, Brooklyn College of the City of New York and Executive Committee, National Jobs for All Coalition, and Bill Ayres, Director, World Hunger Year and Advisory Board, National Jobs for All Coalition.
The President and Congress try to outdo one another on who can cut the Federal budget deficit the most. But efforts to reduce the deficit at the expense of necessary social programs are unnecessary and counter productive. In fact, much of the recent reduction in the deficit is due to the decline in unemployment.
According to the last Congressional Budget Office estimate of the impact of unemployment on the deficit,5 a reduction of unemployment by only one percentage point starting in January 1995 and sustained through fiscal year 2000 would have netted the government $415 billion over those six years. Most of that would come from increased taxes paid by more people working and greater business profits ($315 billion). The rest would result from less money needed for unemployment insurance and other social programs ($32 billion), and less money spent on interest payments to service the debt ($68 billion,$23 billion in fiscal year 2000 alone).
Remember, this $415 billion is from only a one percentage point decrease in unemployment. The mind boggles when confronted by how much could be generated if we actually reached a level of full employment. Think of how that money could then be reinvested in our society to fund the education and training programs we need to raise more than a quarter of our citizens out of poverty and near-poverty, to eliminate hunger, rebuild our transportation systems, housing, and recreation areas, improve our environment and support working parents with child care.
Every percentage point less in unemployment makes good economic sense by not only reducing the budget deficit, but also reducing the human deficit that we see in the economic insecurity, growing poverty, hunger, homelessness and crime that are tearing apart our society. We’ll get stronger families and an enhanced quality of life.
Let’s have full employment and reinvest the savings into a more productive, livable society with Jobs for All!
[1] resulting from recession.
[2] they’ll still be there when the recession is over.
[3] http://www.cbo.gov/publication/43903 Obviously, this target is far above which NJFAC and other supporters of full employment consider an acceptable level of unemployment.
[4] what the budget balance would be if we were at 5.5% unemployment, “high” employment, presumably the best the CBO considers that our economy can manage.
[5] Congressional Budget Office, Economic and Budget Outlook: Fiscal Years 1996-2000 (Jan 1995). The CBO for years has made this estimate, but no longer does so. For further information about the deficit, see Sheila D. Collins, Helen Lachs Ginsburg and Gertrude Schaffner Goldberg, Jobs For All: A Plan for the Revitalization of America, New York: Apex Press. 1994. Chapter 10.
“…we are still in a downturn, with the economy operating at a level of output that is more than $1 trillion below its potential according to the Congressional Budget Office. The most recent projections from the Congressional Budget Office show a baseline deficit projection for fiscal 2014 of around $600 billion. If the economy were operating at potential GDP, this would reduce this figure by around $300 billion. (An additional dollar of output will lead to roughly 30 cents in savings to the government due to higher tax collections and lower payments for programs like unemployment benefits and other transfers.)
This leaves a deficit of around $300 billion or roughly 1.8 percent of GDP. With a deficit of this size the debt-to-GDP ratio would be falling, which means that the government can run a deficit of this size in perpetuity. It is true that in the longer term the deficit is projected to rise due to the rising cost of health care. The United States pays more than twice as much per person for its health care as other countries with nothing to show for this spending in terms of outcomes.” http://cepr.net/its-monday-morning-and-robert-samuelson-is-confused-about-the-economy/
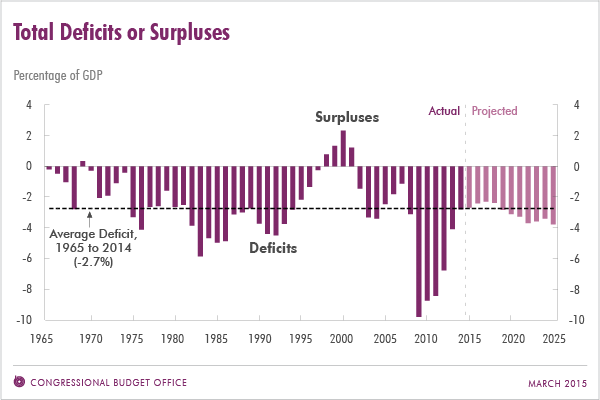
Source: https://www.cbo.gov/publication/49973 Note correspondence of higher unemployment with larger deficits during recessions of early 1980’s, early 2000’s and financial crisis [2007] and surpluses of late 1990’s relatively low unemployment. JZ
Editor: June Zaccone, Economics (Emer.), Hofstra University


