Special Report 6, July 2015 by June Zaccone, Assoc. Prof. of Economics (Emerita), Hofstra University and NJFAC Executive Committee. [lfpr for 25-54 updated, 5/16]
Whenever a recession leads to dropouts from the measured labor force, as those who despair of finding work give up looking, commentators begin asking whether the decline in the labor force participation rate [LFPR] is permanent, and arguing that it is. They also explain that the problem is structural–that jobs are available, but workers are not suited to them by skill or training.
This recession has been accompanied by a sharp reduction in the LFPR. David Leonhardt says, “If the decline stemmed largely from an aging work force, it would be much less worrisome. But the initial wave of baby-boomer retirements plays only a small role in the drop; the labor force participation rate has fallen almost as sharply for people aged 25 to 54 as it has for the overall adult population.” [1]
Source: https://fred.stlouisfed.org/
Reduced participation is the counterpart of fewer prime-age workers being hired. Note the experience of those 25-54, shown in the blue line. They have been displaced by hiring of those over 55–the grey line.
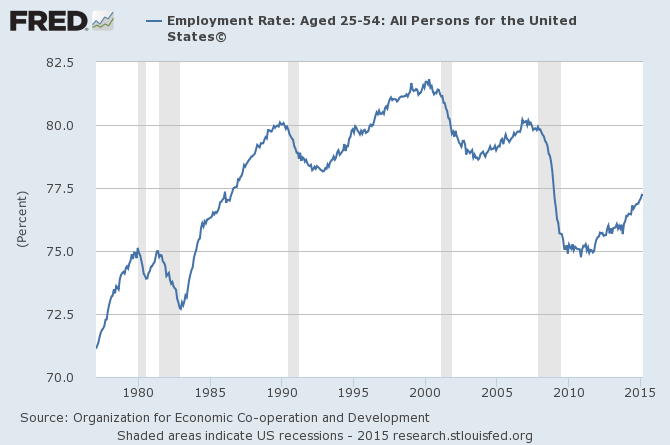
The Economic Policy Institute calls the “drop in employment for ‘prime-age’ workers during [the] 2007 recession truly stunning.” [See below.] EPI recently estimated that in June 2015, 3.3 million people were missing from the labor force. They used the ingenious method of using BLS projections of the LFPR for made before the financial crisis to find the difference between the potential labor force and the currently measured one.
Employment-to-population ratio of workers ages 25-54, 1977-3/2015
There is no evidence of a structural problem, one that would show itself in rising wages for those jobs going begging. Or, that the job vacancy rate shows a surfeit of jobs compared to the number unemployed. In fact, the latest data [5/15] show that there are nearly 4 job-seekers for each available job. [Job-seekers here include those working part-time involuntarily along with those not counted in the labor force but who want a job, in addition to those counted as officially unemployed.]
It is telling that the LFPR was roughly constant in the 1990’s, a period of rapid job expansion and decline in unemployment. In fact, the yearly LFPR reached its postwar maximum, 67.1, in the three years of relatively rapid job expansion 1998-2000. Even before the painfully slow job expansion since the financial crisis, job creation of the Bush Administration from 2001 to 2007 was slowest of the postwar era– only 0.7%/year to the end of 2007.
LFPR age 16 and over Federal Reserve
Dean Baker comments on the decline: “Some seem to view this drop [in the LFPR] as a reflection of a change in people’s willingness to work. While this is possible, it is highly unusual for large numbers of people to suddenly change their attitudes towards work. (Most don’t have this luxury.) The fact that this change in behavior coincides with a period in which many people can’t find jobs leads us demand-side types to think the problem is that people don’t see jobs out there. …. So, we can believe that the dropouts from the labor force indicate a change in willingness to work, or we can believe that this is simply the normal cyclical pattern that we always see with labor force participation rates following employment growth.”
Researchers at the Federal Reserve have found that “cyclical factors account for the bulk of the post-2007 decline in the U.S. labor force participation rate,” and can fully account for that of prime-age adults. Other researchers support this: “The largest declines have occurred in states with the largest job losses.”
Let’s wait for job recovery before deciding that the LFPR has permanently declined. Authors of a Federal Reserve study agree, and predict that“the decline in labor force participation since 2008 is likely more transitory than permanent.”
WHAT HAS HAPPENED TO THOSE NO LONGER LOOKING FOR WORK?
DISABILITY For some older workers facing poor prospects of re-employment, especially those who have done arduous jobs, putting in a claim for disability payments makes sense. According to the Social Security Administration,
Incidence rates tend to increase temporarily in bad economic times. Some individuals who could readily qualify for DI benefits based on the severity of their medically-determinable impairment may be able to work at a level in excess of substantial gainful activity (SGA) given the opportunity and needed assistance. But with elevated unemployment rates like those seen over the last several years, many of these individuals will lose employment and will seek DI benefits.
RETIREMENT Another reaction to continuing high unemployment is that some people retire earlier than they otherwise would. Social Security and, for some, other retirement benefits are preferable to no income once unemployment insurance has lapsed.
PENURY What happens to some dropouts is that they are forced into dependency or worse.
GETTING TO WORK One problem many of the unemployed must cope with is a lack of affordable means to get to work.[2] “Nearly 40 million working-age people now live in parts of major American metropolitan areas that lack public transportation, according to an analysis by the Brookings Institution’s Metropolitan Policy Program.” “Between 2000 and 2012, the number of jobs within the typical commute distance for residents in a major metro area fell by 7 percent.” And buying a car on the income from many jobs is not possible. “Over the last six months, of the net job creation, 97 percent of that is part-time work.” Then, of course, there is the pay lag. The average real hourly earnings of production and non-supervisory workers in the private sector peaked at $9.26 [1982-4 prices] in 1972-3, not reached again since. Using the same base years, the average pay of these workers was $8.74 in December, 2012. Needless to say, car prices have not remained at the 1972 level.
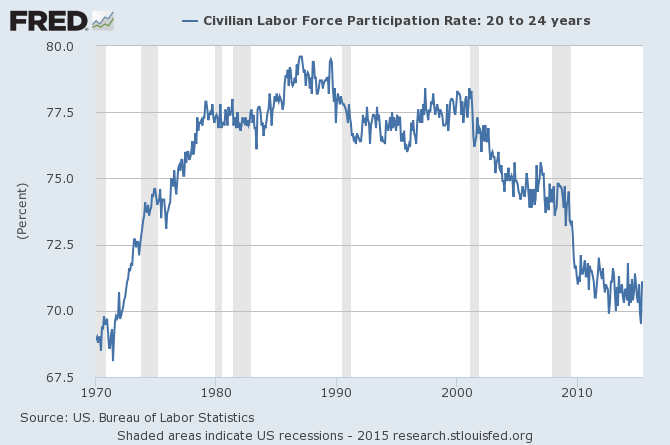
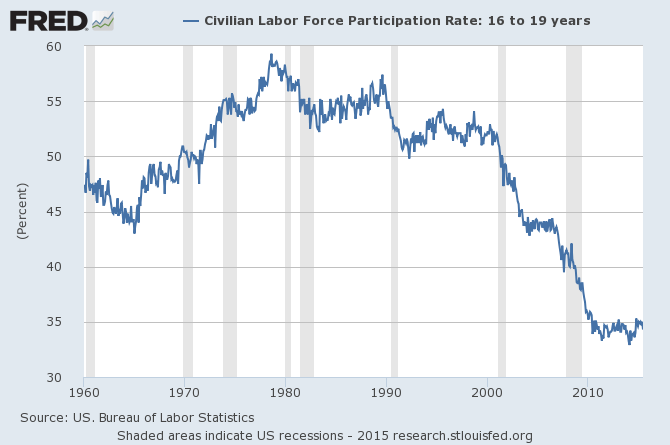
YOUTH AND ITS LABOR PARTICIPATION: The sharp deterioration of the LFPR of young people dates from the recession of the early 2000’s and of course suffered further declines with the Great Recession. The BLS reports that the fraction of young people 16-24 employed [employment to population ratio] during summer 2013, a period when youth employment peaks, was 50.7 percent [7/13] [not seasonally adjusted]. Their LFPR was 60.5 percent in July 2013, unchanged from a year earlier, but 17.0 percentage points below its peak of 77.5 percent in 1989. And apparently the decline does not reflect an increase in college-enrollment. “There has been no recession-induced increase in college or university enrollment for either men or women.”
LABOR FORCE PARTICIPATION AGE 20-24, 1970-6/2015
Their low employment rates reflects the high unemployment rate of those 16 to 19, that is, 23.7% in July 2013. Though students may be in the labor force, they are less likely to be than non-students of that age..
LABOR FORCE PARTICIPATION AGE 16-19, 1960-6/2015
[1] Leonhardt,”The Great Shift: Americans Not Working,” Economix, NY Times, August 28, 2013 Graph http://www.economicpopulist.org/content/unemployment-report-shows-labor-force-drop-outs-record-high-5728
[2] Guerin, Lisa, J.D.,”Collecting Unemployment: Are You Able, Available, and Actively Seeking Work?” Nolo: Law for All, accessed 11/26/15. “You won’t be expected to commute across the state to find a new job, but you must be able to get to a job that’s reasonably nearby if one is offered. If you don’t have a car, can’t get to work by public transportation, and can’t come up with alternative arrangements to get to a job (such as a car pool), you may be deemed ‘unavailable’ to work.” And thus a state might deny unemployment benefits.


