By Frank Stricker
October 10, 2024
Mainstream Views
The BLS report for September was, in the mainstream view of things, pretty positive. Non-farm jobs gathered from employers’ reports increased by 254,000—the biggest increase in six months. In the household survey, the unemployment rate fell a tenth of a point in both August and September, and it now stands at 4.1%. That’s about what is considered full employment. And all of this occurred with lowish annual inflation rates of 2 to 3%. Normally low unemployment is associated with rising prices as demand for goods and workers rises.
NJFAN’s Full Count
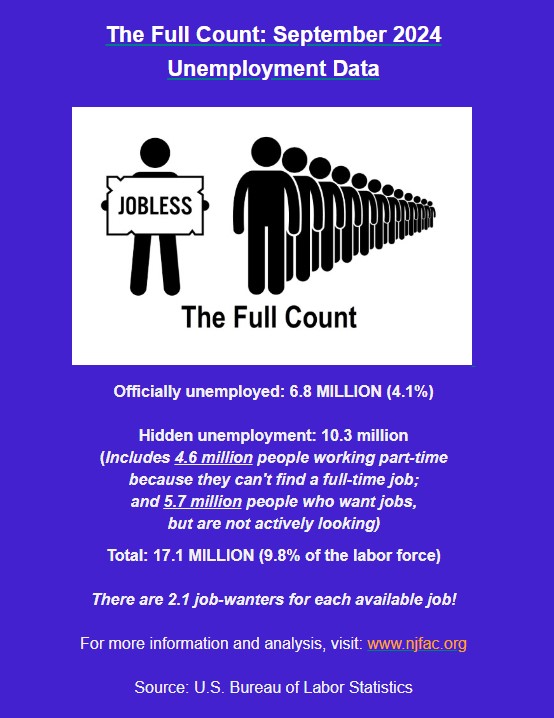
One partial reason for the miracle of low unemployment, and relatively low inflation is that unemployment is really higher than the official rate and so is the supply of willing workers. We in NJFAN believe real unemployment is 9.8%. Also, even the official rates for some groups are quite high, and if we were able to estimate real rates for these groups, they would be shocking. While the official unemployment for whites was 3.6%, it was 5.7% for blacks, 14.3% for all teens, 18.8% for black teens, and 7.2% for disabled workers. More should be done to get people in these categories employed.
Mixed Signals
Other signs about the state of the economy are mixed. Initial claims for unemployment benefits are higher than they were last year in September and October but not by much. The four-week averages of applications were in the range of 210,000 to 219,000 while this year’s late September averages were around 224,000. Not much higher. Then there is the quit-rate which can indicate how confident workers are about finding new jobs. In two pre-pandemic years—2018 and 2019—quit-rates were often 2.3% of total employment. In 2024 through August they have been in a range of 1.9 to 2.2.
Is that a big difference? Are workers more worried about finding new jobs? If you set up your graph the way the BLS does, the rate change can look big, but it seems to me a rather small change. Something like 2% of the labor force is normally quitting their jobs every month, give or take a few tenths of a percentage point.
Special Topic: Manufacturing Jobs in the United States
Did manufacturing jobs increase faster under Trump or Biden? If you leave out the pandemic period of January 2020 through January 2021, it was close, but Biden did better.
Trump without the pandemic:
January 2017-January 2020: roughly 419,000 manufacturing jobs were added to the total.
The first pandemic year—Trump’s last year:
January 2020-January 2021: roughly 597,000 net manufacturing jobs were lost.
Biden’s First Two Years:
January 2021-December 2022: 746,000 manufacturing jobs were added to the total.
But since December 2022, there has been essentially no growth in manufacturing jobs. For about two years the total number has been just under 13,000,000.
A Longer View: Are the main causes in this area things that presidents cannot affect much without drastic actions that cause other problems? The number of manufacturing jobs did not change very much from January 2014 through January of 2024. Just 885,000 manufacturing jobs were added. Meanwhile the total number of non-farm jobs increased by 20,000,000.
Frank Stricker is on the board of the National Jobs for All Network and writes for NJFAN and Dollars and Sense. In 2020 he published a book called American Unemployment: Past, Present, and Future (2020). He taught History and Labor Studies at California State University, Dominguez Hills, for 37 years.

